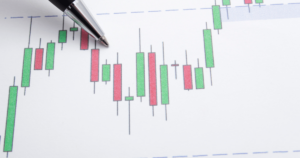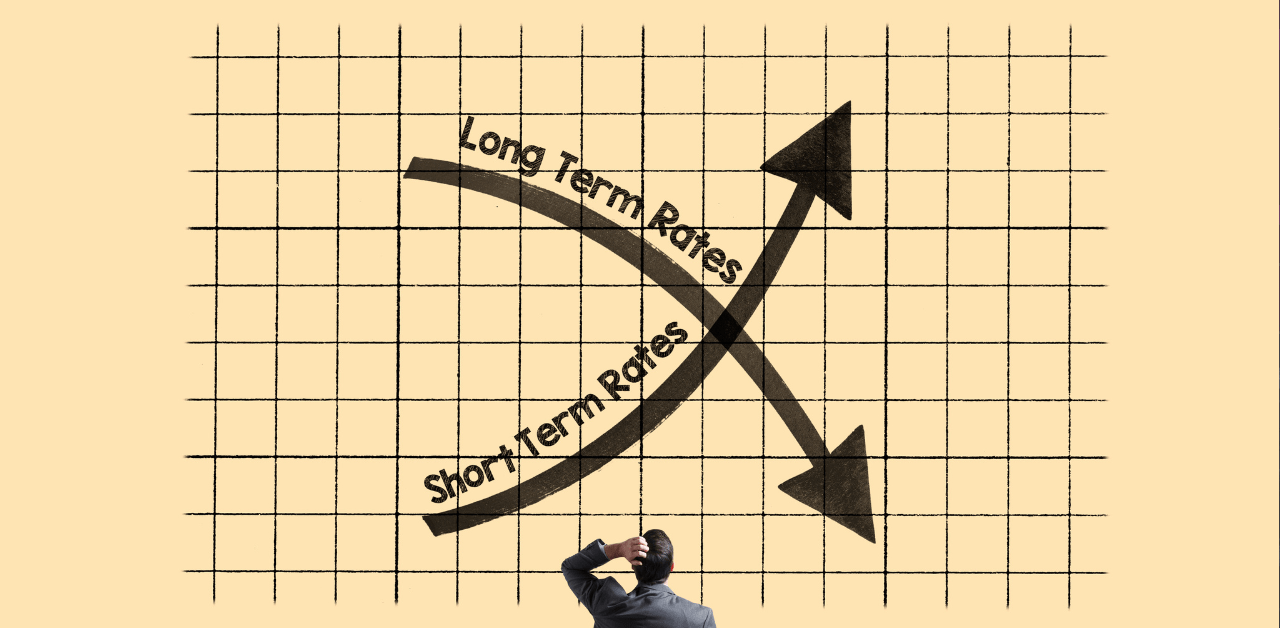
The inverted yield curve is a significant indicator in the bond market that can signal an upcoming recession. It occurs when short-term interest rates exceed long-term rates, and historically, it has been viewed as a reliable recession indicator.
The yield curve, which represents the relationship between yields on bonds of different maturities, typically slopes upwards, reflecting higher yields for longer-term investments. However, when the spread between short-term and long-term interest rates narrows, the yield curve flattens, and an inversion can occur.
An inverted yield curve suggests that market sentiment is becoming more pessimistic about future economic prospects. This has implications for consumers and investors across various segments. Homebuyers with adjustable-rate mortgages may witness an increase in interest rates, making fixed-rate loans a more attractive option. Fixed-income investors may find short-term investments more favorable as they eliminate the risk premium associated with long-term investments. Equity investors could experience a decline in profit margins and may need to assume higher risks to achieve their desired returns.
While yield curve inversions tend to have less impact on consumer staples and healthcare companies, they often precede recessions. Notable examples include the inversions in 1998, 2006, and 2019. However, it’s important to note that an inverted yield curve does not cause recessions; rather, it reflects market expectations for declining longer-term yields.
The 10-year to 2-year Treasury spread is commonly used as a leading indicator of a recession, although there is no consensus on which spread is the most reliable. The current debate among economists revolves around determining whether the current inverted yield curve signals a recession or reflects confidence in managing inflation.
Key Takeaways:
- An inverted yield curve occurs when short-term interest rates exceed long-term rates and is viewed as a reliable recession indicator.
- The yield curve represents the relationship between yields on bonds of different maturities and typically slopes upwards.
- An inverted yield curve suggests market pessimism about future economic prospects.
- Impact of an inverted yield curve is felt by consumers and investors across various segments.
- Historical examples of inverted yield curves preceding recessions include those in 1998, 2006, and 2019.
What is the Yield Curve and How Does it Work?
The yield curve is a graphical representation of the relationship between yields on bonds of various maturities and plays a crucial role in the bond market. It shows the interest rates investors can expect to receive for holding a bond until maturity. Typically, the yield curve slopes upward, reflecting higher yields for longer-term investments. However, it can also flatten or invert, indicating different expectations for future interest rates.
When the yield curve slopes upward, it implies that investors require higher compensation for the risks associated with longer-term bonds. This is because longer-term bonds are exposed to more uncertainties, such as changes in inflation, economic conditions, and monetary policy. In contrast, when the yield curve flattens or inverts, it suggests that investors expect lower or declining interest rates in the future.
An inverted yield curve occurs when short-term interest rates exceed long-term rates. This is uncommon since longer-term debt typically carries greater risk and higher interest rates. Historically, an inverted yield curve has been viewed as an indicator of a pending economic recession.
| Yield Curve Shape | Significance |
|---|---|
| Upward Sloping | Typical yield curve shape, reflecting higher yields for longer-term investments. |
| Flattening | Indicates expectations of stable or declining interest rates in the future. |
| Inverted | Historically viewed as a potential precursor to an economic recession. |
“An inverted yield curve suggests that the market is becoming more pessimistic about the economic prospects for the near future.”
Understanding the Inversion of the Yield Curve
When the spread between short-term and long-term interest rates narrows, the yield curve begins to flatten, and an inversion can occur. An inverted yield curve suggests that the market is becoming more pessimistic about the economic prospects for the near future. It has been a reliable indicator of recessions in the past. Market participants and economists use various yield spreads, such as the 10-year to 2-year Treasury spread, as a proxy for the yield curve.
Understanding the Inversion of the Yield Curve
An inverted yield curve occurs when short-term interest rates exceed long-term rates, indicating a unique market phenomenon. This rare event is often seen as a reliable indicator of an impending recession. To truly understand the implications of an inverted yield curve, we must first grasp the concept of the yield curve and its significance in the bond market.
The yield curve is a graphical representation of the relationship between the yields on bonds with different maturities. Typically, the yield curve slopes upwards, reflecting higher yields for longer-term investments. However, when the gap between short-term and long-term interest rates narrows, the yield curve begins to flatten, and an inversion can occur. This flattening is a result of market expectations for declining longer-term yields.
When an inversion takes place, it suggests that market participants have become more pessimistic about the economic prospects for the near future. This change in sentiment can have far-reaching effects on consumers and investors. Homebuyers with adjustable-rate mortgages may see their interest rates rise, making fixed-rate loans more appealing. Fixed-income investors may find that short-term investments offer better returns than long-term ones, as the risk premium for longer-term investments is eliminated. Meanwhile, equity investors may experience lower profit margins and may need to take on increased risk to achieve their desired returns.
The Impact on Various Sectors
While an inverted yield curve may have less impact on consumer staples and healthcare companies, it is a significant indicator that often precedes recessions. Historical examples, such as the inversions in 1998, 2006, and 2019, have shown this pattern. However, it is important to note that an inverted yield curve does not cause recessions; rather, it reflects market expectations for declining longer-term yields.
The 10-year to 2-year Treasury spread is commonly used as a leading indicator of a recession, but there is no consensus on which spread is the most reliable. The current inverted yield curve has sparked debate among economists, with some predicting a recession and others suggesting that it reflects confidence in managing inflation. This ongoing discussion highlights the complexities and uncertainties surrounding the interpretation of an inverted yield curve.
In conclusion, understanding the inversion of the yield curve is crucial for consumers and investors as it provides insights into economic prospects. While recessions are relatively rare events, an inverted yield curve has historically been a significant indicator of an approaching recession. By recognizing the implications of an inverted yield curve, individuals and businesses can make informed decisions and navigate potential economic challenges with greater confidence.
The Implications of an Inverted Yield Curve
An inverted yield curve has significant implications for the economy, financial markets, and investors due to its historical track record as a recession indicator. When short-term interest rates surpass long-term rates, it often signals a pessimistic outlook on the economy’s future performance.
The impact of an inverted yield curve can be observed in various sectors. Homebuyers with adjustable-rate mortgages may experience rising interest rates, making fixed-rate loans more attractive. Fixed-income investors may find that short-term investments offer better returns due to the elimination of the risk premium associated with long-term investments. Equity investors may witness a decline in profit margins and may need to take on more risk to achieve desired returns.
Historically, yield curve inversions have preceded recessions. Notable examples include the inverted yield curves observed in 1998, 2006, and 2019. While an inverted yield curve does not directly cause a recession, it is considered a reliable indicator of an impending economic downturn. Yield spreads, such as the 10-year to 2-year Treasury spread, are often used as leading indicators for recessions.
However, there is ongoing debate among economists regarding the current inverted yield curve. Opinions differ on whether it signifies an upcoming recession or reflects confidence in managing inflation. While the inverted yield curve remains a key metric for measuring economic prospects, economists continue to analyze its implications and debate its reliability as an economic indicator.
| Implications of an Inverted Yield Curve | – |
|---|---|
| Homebuyers | Adjustable-rate mortgages may see rising interest rates, making fixed-rate loans more attractive. |
| Fixed-Income Investors | Short-term investments may offer better returns than long-term ones due to the elimination of the risk premium. |
| Equity Investors | Profit margins may decline, necessitating increased risk-taking for desired returns. |
The Impact on Borrowers and Homebuyers
An inverted yield curve can have a direct impact on borrowers and homebuyers, influencing their choices between adjustable-rate mortgages and fixed-rate loans. When the yield curve inverts, it indicates a market expectation of economic uncertainty and potential future rate cuts by central banks. This can lead to lower long-term interest rates, which may make fixed-rate loans more attractive to borrowers.
Adjustable-rate mortgages (ARMs) are typically tied to short-term interest rates, such as the London Interbank Offered Rate (LIBOR) or the U.S. Prime Rate. When the yield curve inverts, short-term rates may rise relative to long-term rates, potentially increasing the interest rate on ARMs. This can result in higher monthly payments for borrowers with ARMs, making fixed-rate loans a more stable and predictable choice.
Fixed-rate loans, on the other hand, offer borrowers the security of a consistent interest rate throughout the term of the loan. With an inverted yield curve, the prospect of lower future rates may make fixed-rate loans more appealing, as borrowers can lock in a rate that may be lower than what they could obtain with an ARM in the future.
The Impact on Borrowers:
The table below illustrates the impact of an inverted yield curve on borrowers and homebuyers:
| Interest Rate | Loan Type | Advantages | Disadvantages |
|---|---|---|---|
| Higher short-term rates | Adjustable-Rate Mortgage (ARM) | Lower initial interest rate, potential for lower rates in the future if short-term rates decline | Potential for higher monthly payments if short-term rates rise |
| Lower long-term rates | Fixed-Rate Loan | Consistent interest rate throughout the loan term, protection against potential rate increases | No potential for lower rates in the future if long-term rates decline |
In summary, an inverted yield curve can lead borrowers and homebuyers to consider fixed-rate loans as a means of securing a stable interest rate during a period of economic uncertainty. This can provide peace of mind and protect against potential rate increases in the future.
The Effects on Fixed-Income Investors
Fixed-income investors may experience changes in investment preferences as an inverted yield curve alters the risk and return dynamics of short-term and long-term investments. When the yield curve inverts, it disrupts the typical relationship between short-term and long-term interest rates, leading to a potential shift in investment strategies.
The risk premium, which compensates investors for the risk of holding longer-term bonds, is eliminated when the yield curve inverts. This means that short-term investments may become more attractive compared to long-term investments. Fixed-income investors may adjust their portfolios to focus on shorter-term bonds to take advantage of the higher prevailing yields.
Furthermore, an inverted yield curve is often seen as a signal of economic uncertainty and potential recession. This can prompt fixed-income investors to seek safer investments, such as government bonds, as a way to preserve capital and hedge against potential market volatility. The demand for government bonds may increase, leading to a decrease in their yields and further reinforcing the inversion of the yield curve.
Impact on Risk Management Strategies
An inverted yield curve can also impact fixed-income investors’ risk management strategies. Typically, longer-term bonds have a higher duration, making them more sensitive to changes in interest rates. However, during an inverted yield curve environment, longer-term rates may be lower, reducing the potential downside risk associated with those bonds.
| Investment Strategy | Impact of Inverted Yield Curve |
|---|---|
| Diversification | Investors may consider diversifying their fixed-income portfolios by including alternative fixed-income securities, such as high-yield bonds or emerging market debt. These investments can provide potential yield opportunities and offer additional diversification benefits. |
| Active Management | Fixed-income managers may adjust their investment strategies to take advantage of the yield curve inversion. They may actively manage the duration of their portfolios, favoring shorter-term bonds to capture higher yields and navigate potential market volatility. |
| Income Generation | An inverted yield curve may challenge income-focused investors who rely on fixed income investments for regular cash flows. To maintain income generation, investors may need to explore alternative fixed-income products or strategies that can provide higher yields without excessive risk exposure. |
Overall, an inverted yield curve can significantly impact fixed-income investors’ investment preferences, risk management strategies, and income generation. It is crucial for investors to closely monitor changes in the yield curve and adjust their portfolios accordingly to navigate potential market uncertainties and capitalize on opportunities presented by the inversion.
The Impact on Equity Investors
Equity investors may face challenges such as falling profit margins and the need to assume higher levels of risk when confronted with an inverted yield curve. As the yield curve inverts, it indicates a shift in market sentiment, with investors becoming more cautious about the future economic outlook. This can lead to a decline in stock prices and reduced profit margins for companies.
One of the key reasons for falling profit margins is the potential decrease in consumer spending during a recession. When economic uncertainty looms, consumers tend to tighten their belts, cutting back on discretionary purchases. This can directly impact companies’ revenues and profitability, causing profit margins to shrink.
Another consequence of an inverted yield curve is the increased risk that equity investors may have to take on. As stock prices decline, investors may need to seek out higher-risk investments in order to achieve their desired returns. This could involve investing in more volatile stocks or sectors that are more susceptible to economic downturns.
Moreover, an inverted yield curve may lead to a decline in investor confidence and a reduction in overall market activity. This can create a challenging environment for equity investors, as it becomes harder to identify profitable investment opportunities and navigate the market with limited support.
| Impact on Equity Investors | |
|---|---|
| Falling profit margins | – A decline in consumer spending during a recession can cause companies’ revenues and profitability to shrink. |
| Increased risk | – As stock prices decline, investors may need to take on higher-risk investments to achieve desired returns. |
| Decline in investor confidence | – An inverted yield curve can lead to a reduction in overall market activity and make it harder to identify profitable investment opportunities. |
In conclusion, an inverted yield curve poses challenges for equity investors, including falling profit margins, increased risk, and a decline in investor confidence. It is important for investors to carefully monitor the yield curve and adapt their investment strategies accordingly to navigate the potential impact on the stock market.
Historical Examples of Inverted Yield Curves
Inverted yield curves have occurred in the past and have often been followed by recessions, as evidenced by notable instances in 1998, 2006, and 2019. These historical examples highlight the significance of the inverted yield curve as a potential recession indicator.
In 1998, an inverted yield curve emerged, with short-term interest rates surpassing long-term rates. This inversion was an early warning sign of the dot-com bubble bursting and the subsequent recession that followed in the early 2000s. Investors who were paying attention to the inverted yield curve could have taken measures to protect their portfolios from significant losses.
The year 2006 also saw the emergence of an inverted yield curve, with long-term rates falling below short-term rates. This inversion foreshadowed the global financial crisis of 2008, which led to a severe recession and widespread economic turmoil. The inverted yield curve in 2006 served as a stark warning for investors and policymakers alike.
More recently, in 2019, an inverted yield curve once again sent shockwaves through the financial markets. This inversion prompted concerns about an impending economic downturn and contributed to heightened market volatility. While the full impact of this inverted yield curve is yet to be realized, it serves as a stark reminder of the potential risks that accompany such market phenomena.
| Year | Invert or Not | Subsequent Recession |
|---|---|---|
| 1998 | Inverted | Yes |
| 2006 | Inverted | Yes |
| 2019 | Inverted | Recession Risk |
These examples demonstrate the historical relationship between inverted yield curves and recessions. While an inverted yield curve does not guarantee a recession, it has consistently served as a reliable warning sign for potential economic downturns. Investors and policymakers closely monitor the yield curve and its inversions to inform their decision-making processes and mitigate potential risks.
Debate Among Economists
The current inverted yield curve has sparked debate among economists, with differing views on its implications for a potential recession and inflation control. Some economists believe that the inverted yield curve is a strong indicator of an upcoming recession. They argue that historically, every time the yield curve has inverted, a recession has followed shortly after. These economists point to past instances, such as the inversions in 1998, 2006, and 2019, as evidence of the yield curve’s predictive power.
On the other hand, there are economists who believe that the current inverted yield curve does not necessarily guarantee a recession. They argue that the economic landscape has changed, and factors such as unconventional monetary policies and global economic interdependence have altered the relationship between the yield curve and recessions. These economists suggest that the inverted yield curve may instead reflect market expectations for declining longer-term yields and be more related to inflation control efforts by central banks.
The debate among economists highlights the complexities involved in interpreting the inverted yield curve. While it has historically been a reliable indicator of recessions, there are differing views on its predictive power in the current economic context. The use of yield spreads, such as the 10-year to 2-year Treasury spread, as proxies for the yield curve further adds to the complexity of the debate.
The Leading Indicator of a Recession
The 10-year to 2-year Treasury spread is often considered a leading indicator of a recession, with the inverted yield curve playing a crucial role in this analysis. The yield curve, which represents the relationship between yields on bonds of different maturities, typically slopes upward. However, when short-term interest rates exceed long-term rates, the yield curve can invert, indicating a potential economic downturn.
An inverted yield curve has historically been viewed as a reliable predictor of recessions. One way to measure this inversion is by analyzing the spread between the 10-year Treasury bond yield and the 2-year Treasury bond yield. When this spread becomes negative, meaning the 2-year yield surpasses the 10-year yield, it signals a potential recession on the horizon.
Analysts and economists closely monitor the inverted yield curve and its impact on the treasury spread as part of their recession forecasting models. By comparing the spreads with historical data, they can gauge the likelihood of an impending economic downturn. However, it’s important to note that while an inverted yield curve often precedes a recession, it doesn’t directly cause one. Instead, it reflects market expectations and investors’ sentiments about the future economic landscape.
| Year | 10-Year Treasury Yield | 2-Year Treasury Yield | Treasury Spread |
|---|---|---|---|
| 1998 | 4.68% | 4.78% | -0.10% |
| 2006 | 4.71% | 4.79% | -0.08% |
| 2019 | 1.90% | 1.95% | -0.05% |
Historically, inversions in the 10-year to 2-year Treasury spread have occurred before significant recessions. Examples include 1998, 2006, and 2019, where the spread turned negative prior to economic downturns. However, it’s essential to consider other economic indicators and factors before drawing conclusions solely based on the inverted yield curve.
In summary, the inverted yield curve, along with the 10-year to 2-year Treasury spread, is often used as a leading indicator of a potential recession. This analysis provides valuable insights into market expectations and investor sentiment about the future state of the economy. While it’s not a foolproof predictor, closely monitoring the inverted yield curve and treasury spreads can assist stakeholders in making informed decisions and preparing for possible economic downturns.
Conclusion
Understanding the inverted yield curve is vital for assessing economic prospects, as it provides valuable insights into potential recessions and market expectations. An inverted yield curve occurs when short-term interest rates exceed long-term rates, indicating a pessimistic outlook for the economy. Historically, this has been viewed as a reliable indicator of an impending recession.
The yield curve, a graphical representation of the relationship between yields on bonds of different maturities, typically slopes upwards. However, when the spread between short-term and long-term interest rates narrows, the yield curve flattens and can potentially invert. This suggests that investors are less optimistic about the future economic conditions.
The impact of an inverted yield curve is far-reaching. Homebuyers with adjustable-rate mortgages may face rising interest rates, making fixed-rate loans a more attractive option. Fixed-income investors may find better returns in short-term investments due to the elimination of the risk premium associated with long-term investments. Equity investors may experience falling profit margins and may need to take on increased risk to achieve desired returns.
While yield curve inversions do not directly cause recessions, they have been observed to precede them. Historical examples, such as the inversions in 1998, 2006, and 2019, have been followed by economic downturns. Market participants and economists often use various yield spreads, like the 10-year to 2-year Treasury spread, as proxies for the yield curve and as leading indicators of recessions.
However, the current inverted yield curve has sparked debate among economists. Some predict a recession based on this indicator, while others believe it reflects confidence in managing inflation. The use of different yield spreads and contrasting opinions among experts highlight the complexity of interpreting the inverted yield curve as a recession indicator.
In conclusion, understanding the inverted yield curve is crucial for assessing economic prospects and market expectations. While recessions are relatively rare events, an inverted yield curve has repeatedly demonstrated its significance as a potential recession indicator. By staying informed about this indicator and its implications, consumers and investors can make informed decisions to navigate the economic landscape with greater confidence.
FAQ
Q: What is an inverted yield curve?
A: An inverted yield curve occurs when short-term interest rates exceed long-term rates. This is uncommon since longer-term debt typically carries greater risk and higher interest rates.
Q: What does an inverted yield curve indicate?
A: An inverted yield curve suggests that the market is becoming more pessimistic about the economic prospects for the near future. Historically, it has been viewed as an indicator of a pending economic recession.
Q: How does the yield curve work?
A: The yield curve is a graphical representation of the relationship between yields on bonds of different maturities. It typically slopes upwards, reflecting higher yields for longer-term investments.
Q: How does an inverted yield curve affect borrowers and homebuyers?
A: An inverted yield curve may result in rising interest rates for adjustable-rate mortgages, making fixed-rate loans more attractive to homebuyers.
Q: How does an inverted yield curve impact fixed-income investors?
A: Fixed-income investors may find that short-term investments offer better returns than long-term ones because the risk premium for long-term investments is eliminated.
Q: What are the effects of an inverted yield curve on equity investors?
A: Equity investors may see profit margins fall and may have to take on increased risk to achieve desired returns.
Q: Can an inverted yield curve cause a recession?
A: An inverted yield curve does not cause recessions; rather, it reflects market expectations for declining longer-term yields. It has historically been a significant indicator of a forthcoming recession.
Q: Are there historical examples of inverted yield curves?
A: Yes, there have been notable instances of inverted yield curves in the past, such as those in 1998, 2006, and 2019, which were followed by recessions.
Q: What is the leading indicator of a recession?
A: The 10-year to 2-year Treasury spread is often used as a leading indicator of a recession, although there is no general agreement on which spread is the most reliable.
Q: What is the ongoing debate among economists regarding the current inverted yield curve?
A: There are differing opinions among economists, with some predicting a recession and others suggesting that the inverted yield curve reflects confidence in bringing inflation under control.
Q: Why is understanding the inverted yield curve important?
A: Understanding the inverted yield curve provides insights into economic prospects and serves as a valuable tool for consumers and investors in making informed decisions.