Introduction
Japanese candlestick charts are a widely used and popular tool for analyzing financial markets. Whether you are trading in stocks, forex, commodities, or cryptocurrencies, understanding candlestick charts is essential for identifying market trends and making informed trading decisions. In this comprehensive guide, we will delve into the intricacies of Japanese candlestick charts, exploring their origins, components, and various patterns. By the end of this guide, you will have a solid foundation in reading and interpreting candlestick charts, empowering you to navigate the markets with confidence.
1. What Are Japanese Candlestick Charts?
1.1 Origins of Japanese Candlestick Charts
Japanese candlestick charts have a rich history that dates back several centuries. The technique was first developed in Japan by a rice trader named Munehisa Homma in the 18th century. Homma discovered that the emotions and psychology of traders played a significant role in price movements. He created a visual representation of market price data using candlestick shapes, allowing traders to analyze market trends and make better trading decisions.
1.2 Components of a Candlestick
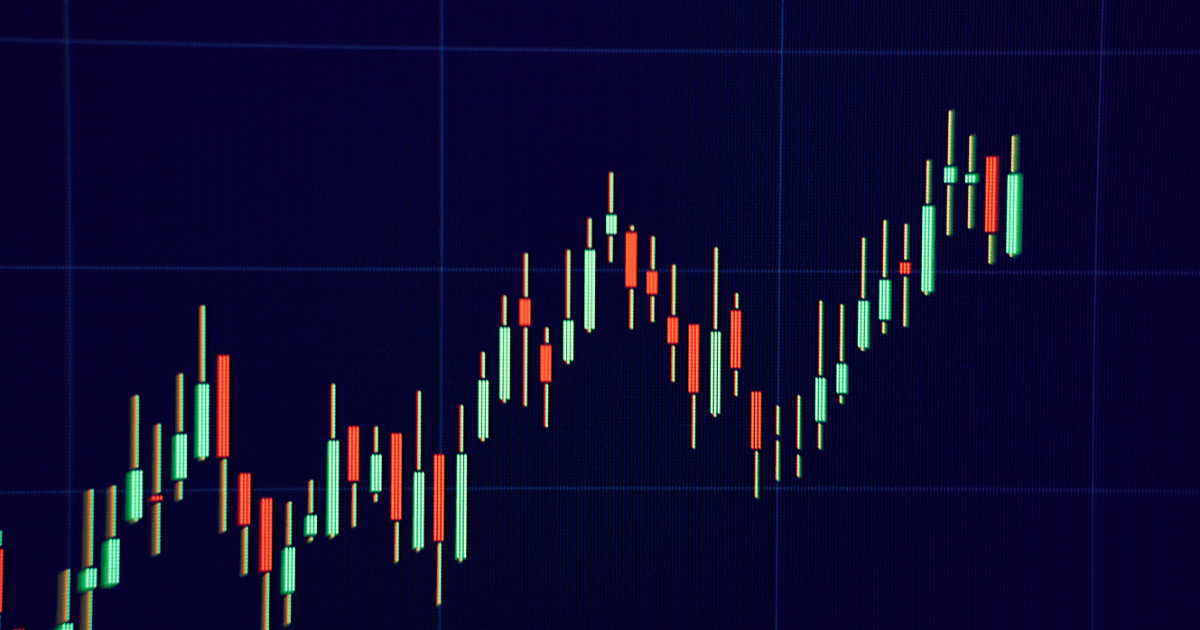
A candlestick consists of several key elements: the body, the wick (or shadow), and the color. The body represents the price range between the opening and closing prices during a specific time period. The wick, which can be either an upper shadow or a lower shadow, indicates the price extremes reached beyond the body. The color of the candlestick provides information about the market sentiment, with green or white indicating a bullish market and red or black indicating a bearish market.
1.3 Candlestick Colors and Meanings
The colors of candlesticks play a vital role in interpreting market sentiment. A green or white candlestick signifies a bullish market, indicating that the closing price is higher than the opening price. On the other hand, a red or black candlestick represents a bearish market, indicating that the closing price is lower than the opening price. Additionally, gray or neutral-colored candlesticks indicate periods of indecision or market equilibrium.
1.4 The Importance of Candlestick Charts in Technical Analysis
Candlestick charts provide traders with a visual representation of price movements and patterns. They offer valuable insights into market sentiment, allowing traders to identify potential trend reversals, continuations, and consolidation periods. By understanding candlestick charts, traders gain an edge in timing their entries and exits, managing risk, and formulating effective trading strategies.
2. Reading Candlestick Charts
2.1 Candlestick Chart Patterns
Candlestick chart patterns are formed by the arrangement of multiple candlesticks and provide valuable information about market dynamics. There are two broad categories of candlestick patterns: single candlestick patterns and multiple candlestick patterns.
2.1.1 Single Candlestick Patterns
Single candlestick patterns, such as doji, hammer, and shooting star, can provide insights into market indecision, potential trend reversals, or continuation of the current trend. These patterns are formed by a single candlestick and are characterized by specific shapes and wick lengths. Understanding the implications of each pattern can help traders make informed trading decisions.
2.1.2 Multiple Candlestick Patterns
Multiple candlestick patterns, such as engulfing patterns, harami, and morning/evening stars, involve the interaction of two or more candlesticks. These patterns provide more significant insights into market trends and reversals. Traders analyze the relationship between the candlesticks, their sizes, and their positions to gauge the strength and direction of the market.
2.2 Understanding Candlestick Patterns and Market Psychology
Candlestick patterns are not just random formations; they reflect the collective psychology and emotions of market participants. Bullish patterns indicate increasing buying pressure, while bearish patterns suggest selling pressure. By understanding the underlying market psychology behind candlestick patterns, traders can anticipate potential market movements and adjust their trading strategies accordingly.
2.3 Support and Resistance Levels in Candlestick Analysis
Support and resistance levels are essential concepts in technical analysis and can be effectively identified and confirmed using candlestick charts. These levels represent price zones where buying or selling pressure is significant, leading to potential price reversals or breakouts. Candlestick patterns that form near support or resistance levels can provide valuable confirmation signals for traders.
2.4 Timeframes and Candlestick Chart Interpretation
Candlestick charts can be applied to various timeframes, ranging from minutes to months or even years. Different timeframes provide different perspectives on market trends and patterns. Shorter timeframes allow for more precise entry and exit points, while longer timeframes provide a broader view of the market. Traders should consider their trading strategies and objectives when selecting the appropriate timeframe for candlestick chart analysis.
2.5 Using Candlestick Patterns in Conjunction with Other Technical Indicators
Candlestick patterns are most effective when used in conjunction with other technical indicators and tools. Traders often combine candlestick analysis with indicators such as moving averages, oscillators, and trend lines to confirm signals and enhance their trading decisions. The convergence of multiple indicators can strengthen the validity of a trade setup and improve the overall accuracy of predictions.
3. Common Candlestick Patterns
3.1 Bullish Reversal Patterns
Bullish reversal patterns indicate a potential change in the direction of a downtrend to an uptrend. These patterns often signal the exhaustion of selling pressure and the emergence of buying interest. Examples of bullish reversal patterns include the hammer, engulfing patterns, and morning stars.
3.2 Bearish Reversal Patterns
Bearish reversal patterns suggest a potential change in the direction of an uptrend to a downtrend. These patterns signal the exhaustion of buying pressure and the emergence of selling interest. Examples of bearish reversal patterns include the shooting star, bearish engulfing patterns, and evening stars.
3.3 Continuation Patterns
Continuation patterns suggest that the prevailing trend is likely to continue after a temporary pause or consolidation. These patterns indicate that the market is taking a breather before resuming its previous direction. Examples of continuation patterns include the flag pattern, pennant pattern, and inside bar pattern.
3.4 Doji and Spinning Top Patterns
Doji and spinning top patterns occur when the opening and closing prices are very close to each other, resulting in a small or nonexistent body. These patterns represent market indecision and can signal potential trend reversals or continuation, depending on the context and preceding price action.
3.5 Engulfing Patterns
Engulfing patterns are formed when one candlestick completely engulfs the body of the previous candlestick. Bullish engulfing patterns occur in a downtrend and suggest a potential trend reversal to the upside. Bearish engulfing patterns occur in an uptrend and indicate a potential trend reversal to the downside.
3.6 Hammer and Hanging Man Patterns
The hammer and hanging man patterns have long lower shadows and small bodies located near the top of the candlestick. Hammers occur during downtrends and indicate potential bullish reversals, while hanging man patterns occur during uptrends and suggest potential bearish reversals.
3.7 Shooting Star and Inverted Hammer Patterns
Shooting star patterns have long upper shadows and small bodies located near the bottom of the candlestick. These patterns occur during uptrends and can signal potential bearish reversals. Inverted hammer patterns have long upper shadows and small bodies located near the bottom of the candlestick. They occur during downtrends and suggest potential bullish reversals.
4. Advanced Candlestick Techniques
4.1 Japanese Candlestick Trading Strategies
Japanese candlestick trading strategies involve combining candlestick patterns with other technical analysis tools to generate trading signals and manage risk. Trend reversal strategies